How Operations Consultants Showcase Their Methodology and ROI Results on Squarespace
Key Takeaways How Operations Consultants Showcase Their Methodology and ROI Results on Squarespace
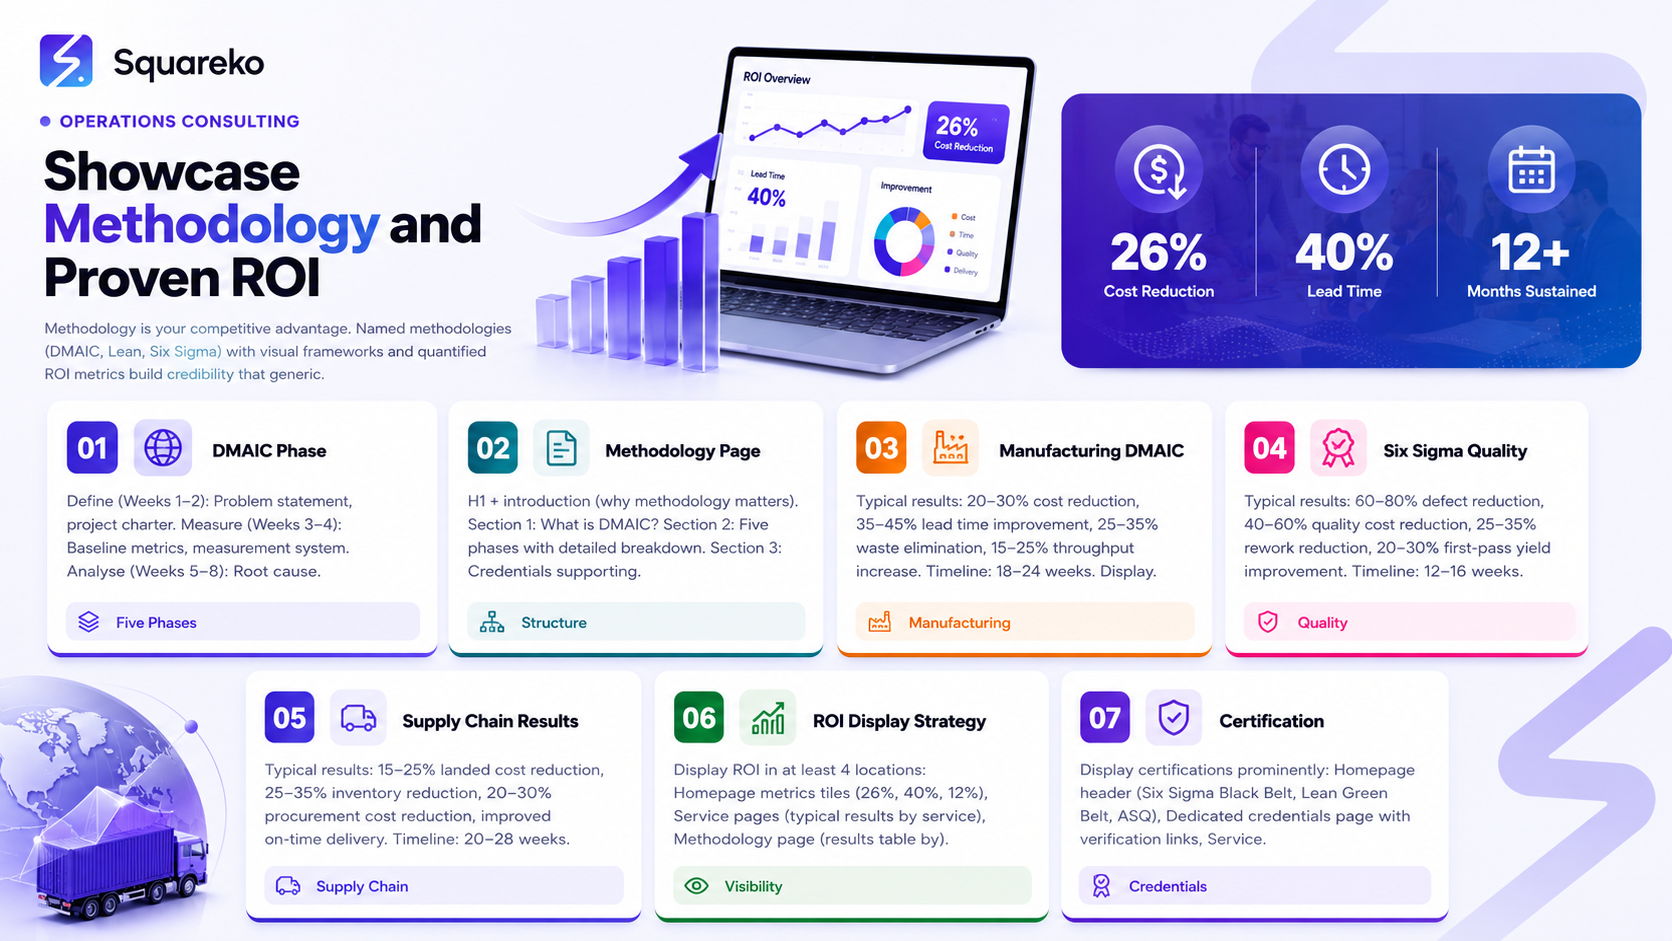
Your methodology is a trust anchor: Named methodologies (DMAIC, Lean, Six Sigma, PROCESS, Kaizen) communicate systematic expertise. Generic "efficiency improvement" language loses deals to consultants with specific methodology
Methodology pages must be visual and interactive: Operations directors understand process flows, DMAIC phases, and improvement frameworks visually. Your methodology page needs diagrams, flowcharts, and phase-based breakdowns, not just text
ROI metrics must be specific and contextualized: "26% cost reduction in manufacturing supply chain over 18 weeks" ranks higher in credibility than "Achieved significant cost savings." Always include metric type, percentage, industry context, and timeline
Lean/Six Sigma certifications must be visually prominent and verifiable: Green Belt, Black Belt, ASQ, IASSC, PMI certifications are trust signals. Display them alongside methodology pages and in multiple locations on your website
Before-and-after visual presentation drives conversion: Side-by-side process diagrams, metrics comparison sliders, or timeline displays showing improvement progress convert better than text-only case studies
Methodology educational content (blogs, guides, webinars) builds thought leadership and SEO authority: Publish detailed content explaining DMAIC, VSM, Kaizen, 5S, PDCA. This content ranks for high-intent keywords and establishes you as an expert
Methodology is your competitive advantage. A COO or operations director doesn't hire a "consultant"; they hire a systematic approach to solving operational problems. Your website must communicate exactly how you solve problems (DMAIC, Lean, Six Sigma, PROCESS framework) and prove that your approach delivers measurable results (26% cost reduction, 40% cycle time improvement, 18% waste elimination).
Most operations consultants bury their methodology in service descriptions or explain it in vague, generic language. That's a lost opportunity. Your methodology page should be one of your most powerful assets: a clear, visual explanation of how you approach operational challenges, backed by certified credentials (Green Belt, Black Belt, ASQ, IASSC, PMP) and quantified results.
This guide covers the complete strategy for showcasing methodology and ROI on Squarespace: methodology page architecture, visual framework design, ROI metrics display strategy, before-and-after case study presentation, certification visibility, and Squarespace-specific tools for methodology presentation.
Methodology Page Architecture
Your methodology page should be one of the longest, most detailed pages on your website. It's not a service page; it's an educational resource that establishes your expertise.
Recommended Structure
H1 (primary): "Our Operational Improvement Methodology: DMAIC Framework for Sustainable Results"
Introduction (2-3 paragraphs): Explain why methodology matters. "Operational improvement without systematic methodology is hope, not consulting. Our DMAIC methodology ensures every engagement follows a disciplined, data-driven approach to identifying root causes, testing solutions, and sustaining results."
Section 1: What Is DMAIC? (H2)
Explain your methodology framework concisely:
"DMAIC stands for Define, Measure, Analyze, Improve, Control. It's a structured, five-phase process for improving operational performance. Each phase has specific deliverables, tools, and timelines.
The methodology is proven: DMAIC has improved operations at 10,000+ companies globally, from manufacturing to financial services to healthcare. It works because it forces discipline into the improvement process. You can't skip steps, guess at root causes, or implement solutions without data."
Section 2: The Five Phases of DMAIC (H2)
Create a detailed breakdown of each phase with specific outcomes:
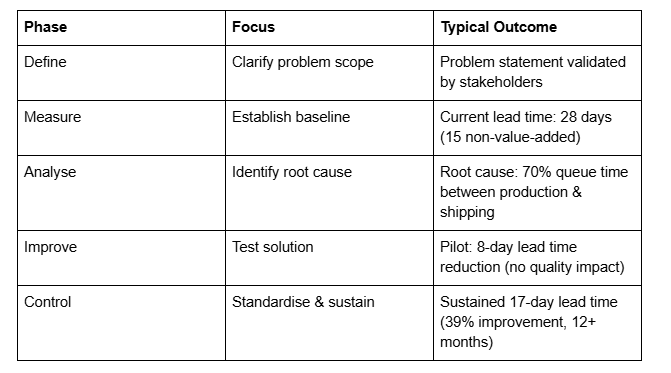
H3: Phase 1 – Define (Weeks 1-2)
Purpose: Define the problem, establish scope, identify stakeholders
Activities: Problem statement development, project charter creation, stakeholder engagement
Deliverables: Written problem statement, project charter, team roster
Tools: SIPOC (Suppliers, Inputs, Process, Outputs, Customers), stakeholder analysis
H3: Phase 2 – Measure (Weeks 3-4)
Purpose: Measure current state performance, establish baseline metrics
Activities: Data collection, process observation, baseline establishment
Deliverables: Baseline metrics, measurement system validation
Tools: Value Stream Mapping (VSM), data collection plans, measurement system analysis (MSA)
Typical findings: "Current lead time: 28 days. Non-value-added time: 15 days (54% waste)"
H3: Phase 3 – Analyse (Weeks 5-8)
Purpose: Identify root causes of the problem
Activities: Data analysis, hypothesis testing, root cause identification
Deliverables: Root cause analysis report
Tools: Pareto analysis, fishbone (Ishikawa) diagrams, regression analysis, hypothesis testing
Typical findings: "Root cause: 70% of queue time occurs between production and shipping"
H3: Phase 4 – Improve (Weeks 9-12)
Purpose: Design and test solutions, validate improvement
Activities: Solution brainstorming, pilot testing, solution refinement
Deliverables: Implementation plan, training materials, control plans
Tools: Design of Experiments (DOE), Kaizen events, process redesign
Typical results: "Pilot test shows 8-day reduction in lead time without quality impact"
H3: Phase 5 – Control (Weeks 13+)
Purpose: Standardize improvements and prevent regression
Activities: Standard work documentation, training, ongoing monitoring
Deliverables: Standard operating procedures, control charts, dashboard
Tools: Control charts (SPC), standard work, visual management, Poka Yoke (mistake-proofing)
Sustained results: "After 12 months, improvements sustained. Lead time remains 17 days (39% improvement)"
Each phase should include a visual diagram showing that phase in context of the full DMAIC cycle.
Section 3: Why DMAIC Works (H2)
Explain the business logic:
"DMAIC works because it's disciplined and data-driven. Every recommendation is backed by evidence, not intuition. Every solution is tested before full implementation. Every improvement is monitored to prevent regression.
Most 'operational improvements' fail because they skip steps. Teams guess at root causes, implement solutions without testing, and see problems return 6 months later. DMAIC prevents this by forcing discipline into every phase."
Section 4: Our Lean and Six Sigma Certifications (H2)
Display your credentials prominently:
"Our DMAIC methodology is grounded in Lean and Six Sigma certifications. Your Name holds the following credentials:
Six Sigma Black Belt (International Association for Six Sigma Certification, issued 2020)
Qualified to lead complex, multi-functional improvement projects using DMAIC
Completed 4+ Black Belt projects with minimum £250K improvement each
Lean Green Belt (Lean Enterprise Institute, issued 2019)
Trained in Lean principles and Value Stream Mapping
Completed 2+ Green Belt projects demonstrating waste elimination and lead time reduction
ASQ Certified Quality Engineer (CQE) (American Society for Quality, issued 2018)
Advanced quality system knowledge and statistical techniques
All certifications are verified through official issuing body directories:" Link to ASQ verification Link to IASSC verification Link to Lean Institute verification
Section 5: Typical DMAIC Results (H2)
Show ROI outcomes from your engagements (anonymised):
"Our DMAIC engagements typically deliver:
These results aren't guarantees, but they reflect what we typically see when DMAIC is applied systematically."
Section 6: How We Customize DMAIC for Your Challenge (H2)
Explain flexibility:
"While our core methodology is DMAIC, we customize the approach for your specific challenge. Manufacturing operations might emphasis OEE (Overall Equipment Effectiveness) and production scheduling. Supply chain challenges might emphasis procurement cost and inventory optimization. Financial operations might emphasis cycle time and process automation.
Our methodology is the framework; your challenge shapes the specifics."
Section 7: Download Our DMAIC Implementation Guide (H2)
Email capture for thought leadership:
"Get our free DMAIC implementation checklist. This 8-page guide walks through each phase, includes templates, and shows real examples from operations projects.
Email capture form: Name, Email → Download PDF"
Section 8: Your Methodology is Foundation for Partnership (H2)
Close with partnership framing:
"Your DMAIC journey starts with understanding. We recommend a free operational assessment where we walk through your challenge, explain how DMAIC applies to your situation, and outline what a potential engagement might look like.
There's no obligation. This assessment is about ensuring we're a good fit for your needs."
[CTA: Book a free operational assessment]
Creating a Visual Methodology Framework
Text-only methodology explanations lose readers. Visuals are essential.
DMAIC Cycle Diagram
Create a visual showing the five DMAIC phases in a cyclical diagram:
Tools to create this (all available, many free):
Figma (free tier): Create custom designs
Canva (free tier): Pre-built diagram templates
Lucidchart (free tier): Flowchart and process diagram tools
Microsoft Visio or Google Drawings
Design elements:
Central circle showing "Continuous Improvement Cycle"
Five segments showing D, M, A, I, C
Each segment colour-coded (blue for Define, green for Measure, etc.)
Arrows showing continuous flow
Typical timeline for each phase (Weeks 1-2, Weeks 3-4, etc.)
Key deliverable or outcome for each phase
Placement: Embed this diagram early in your methodology section, preferably right after the introduction. Make it large (800px+ wide) and visually prominent.
Phase-by-Phase Breakdown Diagrams
For each DMAIC phase, create a detailed diagram showing:
Activities within that phase (3-4 key activities)
Tools used (VSM, fishbone, DOE, etc.)
Deliverables (project charter, baseline metrics, root cause report, etc.)
Typical timeline
Example: Define Phase Diagram
┌─────────────────────────────────┐
│ DEFINE PHASE │
│ (Weeks 1-2, 40 hours) │
├─────────────────────────────────┤
│ Activities │
│ • Develop problem statement │
│ • Create project charter │
│ • Identify stakeholders │
│ • Form improvement team │
│ Tools: SIPOC, Stakeholder Map │
│ Deliverables │
│ → Problem statement │
│ → Project charter │
│ → Team roster │
└─────────────────────────────────┘
Create similar diagrams for Measure, Analyses, Improve, and Control phases.
Methodology Comparison Diagram (Optional)
If you use multiple methodologies (DMAIC + Kaizen, Lean + Six Sigma), create a comparison showing when each is appropriate:
┌──────────────────────────────────────────┐
│ WHICH METHODOLOGY FOR YOUR CHALLENGE? │
├──────────────────────────────────────────┤
│ DMAIC (Six Sigma) │
│ Best for: Complex problems, statistical │
│ Root cause unclear, data-driven │
│ Timeline: 12-20 weeks │
│ Lean Kaizen Events │
│ Best for: Rapid improvement, team │
│ Root cause obvious, quick wins │
│ Timeline: 1-week events │
│ Value Stream Mapping (VSM) │
│ Best for: Flow and waste identification │
│ Large process mapping needed │
│ Timeline: 2-4 weeks │
└──────────────────────────────────────────┘
ROI Metrics Display Strategy
ROI metrics are the primary decision driver. Display them prominently and specifically.
Metrics Display Locations
1. Homepage Hero Section (Above the Fold)
Show 3-5 key metrics in large, visual tiles:
┌─────────────────┬─────────────────┬─────────────────┐
│ 26% Cost │ 40% Cycle │ 18% Waste │
│ Reduction │ Time Reduction │ Elimination │
│ In manufacturing│ In manufacturing│ In typical │
│ supply chain │ operations │ operations │
│ (avg result) │ (avg result) │ (avg result) │
└─────────────────┴─────────────────┴─────────────────┘
2. Service Pages (Per-Service ROI)
Each service page shows typical ROI for that service:
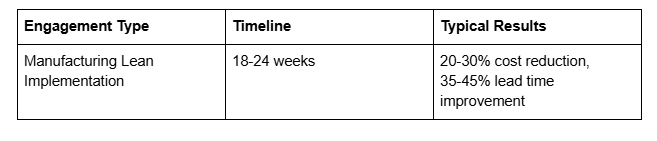
Lean Implementation Service Page:
Typical LEAN IMPLEMENTATION Results:
• 20-30% production cost reduction
• 35-45% lead time improvement
• 25-35% waste elimination
• 15-25% throughput increase
• Timeline: 18-24 weeks
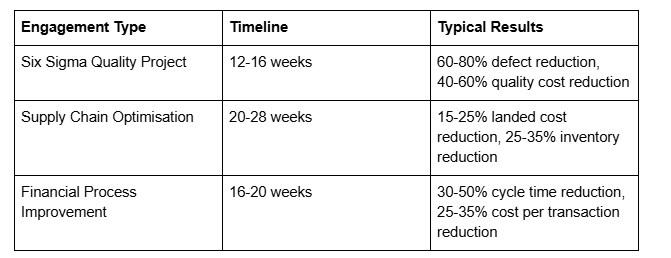
Six Sigma Quality Service Page:
Typical SIX SIGMA QUALITY Results:
• 60-80% defect reduction
• 40-60% quality cost reduction
• 25-35% rework reduction
• 20-30% first-pass yield improvement
• Timeline: 12-16 weeks
3. Methodology Page (Framework + Results)
Show how each DMAIC phase contributes to results:
4. Case Study Pages (Specific Results)
Each case study should have a prominent "Results" section:
RESULTS ACHIEVED
Cost Reduction: £180,000 annual savings
Lead Time: 28 days → 17 days (39% improvement)
Inventory Impact: 5,500 units in-process freed (£180K working capital)
Quality: Defects reduced 32%, first-pass yield improved 18%
Throughput: Capacity increased 22% without new equipment
Timeline: 18 weeks from project start to sustained results
Metrics Display Tools in Squarespace
Option 1: Native Squarespace Metrics Blocks
Squarespace's newer templates (Force, Momentum) include built-in metric/stat blocks:
Title: "Typical Lean Implementation Results"
Stat 1: "26%" with description "Cost Reduction"
Stat 2: "40%" with description "Cycle Time Improvement"
Stat 3: "18%" with description "Waste Elimination"
These render beautifully on mobile and desktop.
Option 2: Custom HTML/CSS Blocks
If your template doesn't include native metrics blocks, use Squarespace's HTML blocks:
<div style="display: grid; grid-template-columns: repeat(3, 1fr); gap: 20px; padding: 40px 0;">
<div style="text-align: center; padding: 30px; border: 1px solid #ddd; border-radius: 8px;">
<h3 style="font-size: 48px; color: #1a73e8; margin: 0;">26%</h3>
<p style="font-size: 18px; color: #666; margin: 10px 0;">Cost Reduction</p>
<p style="font-size: 14px; color: #999;">In manufacturing supply chain (typical)</p>
</div>
<div style="text-align: center; padding: 30px; border: 1px solid #ddd; border-radius: 8px;">
<h3 style="font-size: 48px; color: #1a73e8; margin: 0;">40%</h3>
<p style="font-size: 18px; color: #666; margin: 10px 0;">Lead Time Reduction</p>
<p style="font-size: 14px; color: #999;">In manufacturing operations (typical)</p>
</div>
<div style="text-align: center; padding: 30px; border: 1px solid #ddd; border-radius: 8px;">
<h3 style="font-size: 48px; color: #1a73e8; margin: 0;">18%</h3>
<p style="font-size: 18px; color: #666; margin: 10px 0;">Waste Elimination</p>
<p style="font-size: 14px; color: #999;">In typical operations (typical)</p>
</div>
</div>
Option 3: Comparison Tables
Squarespace supports native comparison tables. Use these to show before-and-after metrics:
Lean/Six Sigma Certification Display
Certifications are trust anchors. Display them prominently in multiple locations.
Certification Display Locations
Location 1: Sidebar or Header
In your site navigation or header, display a small badge: "Six Sigma Black Belt | ASQ Certified | Lean Green Belt"
Location 2: Dedicated Credentials Page
Create a /credentials page listing all certifications:
CREDENTIALS & CERTIFICATIONS
Six Sigma Black Belt
Issued: 2020
Issuing Body: International Association for Six Sigma Certification (IASSC)
Verify: https://www.iassc.org/get-certified/verify-a-certificate
Lean Green Belt
Issued: 2019
Issuing Body: Lean Enterprise Institute
Verify: https://www.lean.org/certifications/verify
ASQ Certified Quality Engineer (CQE)
Issued: 2018
Issuing Body: American Society for Quality (ASQ)
Verify: https://www.asq.org/cert-verification
Project Management Professional (PMP)
Issued: 2017
Issuing Body: Project Management Institute (PMI)
Verify: https://www.pmi.org/certifications/verify
Location 3: Methodology Page
In your DMAIC/methodology section, display certifications that support that methodology:
"This DMAIC methodology is backed by formal Lean and Six Sigma certifications:
Six Sigma Black Belt (IASSC) - qualified to lead DMAIC projects
Lean Green Belt (LEI) - trained in waste elimination and flow"
Location 4: About/Team Page
Feature your name, photo, and credentials prominently.
Location 5: Blog Post Author Bio
End every blog post on operations consulting topics with:
"By Your Name, Six Sigma Black Belt, ASQ Certified. [Your Name] has completed 50+ DMAIC projects and specializes in manufacturing and supply chain operations."
Certification Logo Usage
Display official certification logos where available:
ASQ logo (available from asq.org)
Lean Enterprise Institute (LEI) logo (available from lean.org)
IASSC logo (available from iassc.org)
PMI logo (available from pmi.org)
Using official logos significantly increases credibility. Place logos in a grid on your credentials page or in the methodology section.
Before-and-After Case Study Presentation
Before-and-after presentation is the most powerful conversion tool for operations consultants.
Visual Before-and-After Strategies
Strategy 1: Process Diagram Comparison
Show the before process (with waste highlighted) alongside the after process (streamlined):
BEFORE AFTER
┌──────────────┐ ┌──────────────┐
│ Customer │ │ Customer │
│ Order │ │ Order │
└──────────────┘ └──────────────┘
↓ ↓
┌──────────────┐ ┌──────────────┐
│ Procurement │ │ Procurement │
│ 5 days │ │ 2 days │
└──────────────┘ └──────────────┘
↓ ↓
┌──────────────┐ ┌──────────────┐
│ [WAIT] Queue │ │ Production │
│ 10 days │ │ 8 days │
│ (WASTE) │ └──────────────┘
└──────────────┘ ↓
↓ ┌──────────────
┌──────────────┐ │ Ship │
│ Production │ │ 2 days │
│ 8 days │ └──────────────┘
└──────────────┘
↓ TOTAL: 12 days
┌──────────────┐ (Down from 28 days)
│ Ship │ 57% LEAD TIME
│ 2 days │ REDUCTION
└──────────────┘
↓
TOTAL: 28 days
(WASTE: 10 days = 36%)
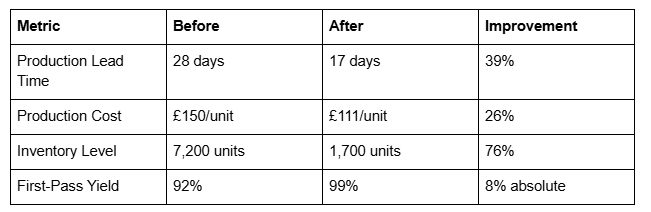
Strategy 2: Metrics Comparison Slider
Use a before-and-after comparison slider where visitors drag between before and after metrics.
Example: "Drag to see the improvement"
Before: "Production Lead Time: 28 days | Cost: £150/unit | Quality: 92% first-pass yield" [Slider ←→] After: "Production Lead Time: 17 days | Cost: £111/unit | Quality: 99% first-pass yield"
Strategy 3: VSM (Value Stream Map) Comparison
Manufacturing operations consultants should show before-and-after Value Stream Maps:
Before VSM: Shows production flow with queue times, cycle times, and total lead time. Highlight non-value-added time in red.
After VSM: Shows streamlined flow with reduced queues, shorter cycle times, and total lead time.
Strategy 4: Timeline Showing Improvement Progress
Show how improvements unfolded over the engagement timeline:
IMPROVEMENT TIMELINE
Week 1-2 (Define)
├─ Problem statement: "28-day lead time with 10 days non-value-added"
└─ Current state mapped
Week 3-4 (Measure)
├─ Data validated: 15 days average queue time between departments
└─ Root cause hypothesis: workflow gaps, lack of integration
Week 5-8 (Analyze)
├─ Statistical analysis: queue time between Prod & Shipping is 70% of total waste
└─ Root cause: manual handoff, missing integration
Week 9-12 (Improve)
├─ Pilot: New procurement process tested, lead time: 23 days
├─ Pilot successful, expanded to full implementation
└─ Full rollout: lead time stable at 17 days
Week 13+ (Control)
├─ Standard operating procedures documented
├─ Performance dashboard installed
└─ Results sustained 12+ months: 17-day lead time, 39% improvement, £180K annual impact
Downloadable Methodology Assets
Downloadable assets build your email list and provide ongoing touchpoints.
Recommended Assets
Asset 1: DMAIC Implementation Checklist (5-8 pages)
Phase-by-phase checklist
Key activities for each phase
Tools and deliverables
Timeline estimate
Email capture: Name, Email → Download PDF
Asset 2: Lean Waste Assessment Template (3-5 pages)
List of 8 types of waste (motion, waiting, processing, etc.)
Assessment worksheet
Scoring methodology
Email capture: Name, Company, Email → Download
Asset 3: Value Stream Mapping (VSM) Guide (8-10 pages)
What is VSM?
How to build a VSM
How to identify opportunities
Case study example
Email capture: Name, Email, Company → Download
Asset 4: ROI Calculator (Interactive)
Input current costs, lead time, quality metrics
Estimate potential improvement (using your typical ROI %)
Show projected savings
CTA: "Let's discuss how to achieve these savings. Book a consultation"
Asset 5: 30-Day Lean Audit Report (8-10 pages)
What we look for in a Lean audit
Assessment criteria
Sample report
Next steps
CTA: Book an audit
Email Capture Integration in Squarespace
For each downloadable asset, create a landing page with email capture:
Brief intro: Explain why this asset matters
Email form: Name, Email, Company, [Optional: Role, Industry]
Instant PDF download: After form submission, immediately serve PDF
Email follow-up: Send PDF via email + nurture sequence
Squarespace integrates with:
Convert Kit (free → PDF download)
HubSpot Forms (free → PDF download)
Zapier (any email tool → PDF delivery)
Squarespace Tools for Methodology Presentation
Squarespace offers several tools optimised for methodology and ROI presentation:
1. Custom Codes Blocks (HTML/CSS/JavaScript)
Perfect for custom diagrams, flowcharts, comparison sliders, and interactive elements.
When to use:
DMAIC cycle diagrams
Process flow comparisons
Custom metric displays
Interactive timelines
Limitation: Requires HTML/CSS knowledge or pre-built code.
2. Image Galleries with Captions
Use Squarespace's native gallery feature to show before-and-after case study imagery.
Setup:
Upload before image + caption ("Before: 28-day lead time")
Upload after image + caption ("After: 17-day lead time, 39% improvement")
Use gallery layout: side-by-side or carousel
3. Comparison Tables (Native Feature)
Squarespace now supports native comparison tables, perfect for:
DMAIC phase breakdown
Before-and-after metrics
Service ROI comparison
Methodology comparison
4. Video Embeds
Embed YouTube videos explaining:
DMAIC phases
Lean principles
Case study walkthroughs
Client testimonials
Recommendation: Create 3-5 short videos (2-3 minutes each):
"What Is DMAIC?" (overview)
"Value Stream Mapping Explained" (methodology tool)
"How We Delivered 26% Cost Reduction" (case study walkthrough)
"Lean vs. Six Sigma: Which Is Right for You?" (comparison)
5. Testimonial Sections
Squarespace's testimonial feature supports:
Client name and title
Company name and logo
Testimonial text
Optional photo/video
Use for:
Operations director testimonials
Specific ROI quotes: "They delivered 26% cost reduction in 18 weeks"
Before-and-after quotes: "Before engagement, we thought we were stuck at 28-day lead time. Now we're running 17 days consistently"
6. Email Capture Forms (Native)
Squarespace forms integrate with:
ConvertKit
MailerLite
HubSpot
Zapier (connect to any email platform)
Use for:
Methodology guide downloads
Case study PDF downloads
Newsletter signup
Discovery call requests
7. Scheduling Integration
Embed booking widgets from:
Calendly
Acuity Scheduling
HubSpot Meetings
Display scheduling widget on:
Methodology page: "Schedule a free assessment to discuss your challenge"
Service pages: "Book a Service consultation"
CTA buttons throughout
FAQs
-
A: Display both. Typical ROI results (26% cost reduction, 40% lead time improvement) provide context and set expectations. Case study-specific results (the detailed numbers from individual projects) prove you can deliver. The combination is most credible.
-
A: Certifications aren't arrogance; they're credentials. Your Green Belt and Black Belt certifications mean you've completed rigorous training and passed exams. Display them confidently. Frame them in context: "Our Six Sigma Black Belt certification ensures every DMAIC project follows disciplined methodology."
-
A: Absolutely. Most clients require anonymisation. Use industry and company size: "A mid-market manufacturing company" or "A 200-person distribution centre." Focus on methodology and results, not client identity. Anonymised case studies with specific ROI metrics are credible and protect client privacy.
-
A: Start with detailed case studies from your first 3-5 clients (even small engagements count). Feature them prominently. Add testimonials emphasising the improvement achieved. Build a blog showcasing your methodology expertise (DMAIC guides, Lean principles, etc.). As you gain more case studies, expand your library. Quality over quantity: one detailed, metrics-rich case study beats ten generic ones.
-
A: Yes. A 2-3 minute video explaining DMAIC phases and how they apply to operations improvement converts well. Videos personalise your methodology and build connection. Include a CTA: "See how DMAIC applies to your specific challenge. Book a consultation."
-
A: All three are credible, but your primary metric depends on your target. Manufacturing operations cares about cost reduction + lead time + quality. Supply chain cares about cost reduction + delivery speed. Financial operations cares about cycle time + cost per transaction. Display the metrics most relevant to your target buyer.

From custom website design to SEO strategy, we help businesses launch a site that looks professional and performs better.

Author Bio
Walid Hassan is the founder of Squareko
I'm Walid Hasan, a Certified Squarespace Expert and Squarespace Circle Platinum Partner with over 12 years of hands-on experience designing and optimizing high-performing websites. Over the years, I've had the privilege of building more than 2,000 Squarespace websites for clients around the world, always focusing on clean design, strong user experience, and conversion-driven results.