How Education Consultants Showcase OFSTED Evidence and School Impact on Squarespace
Key Takeaways How Education Consultants Showcase OFSTED Evidence and School Impact on Squarespace
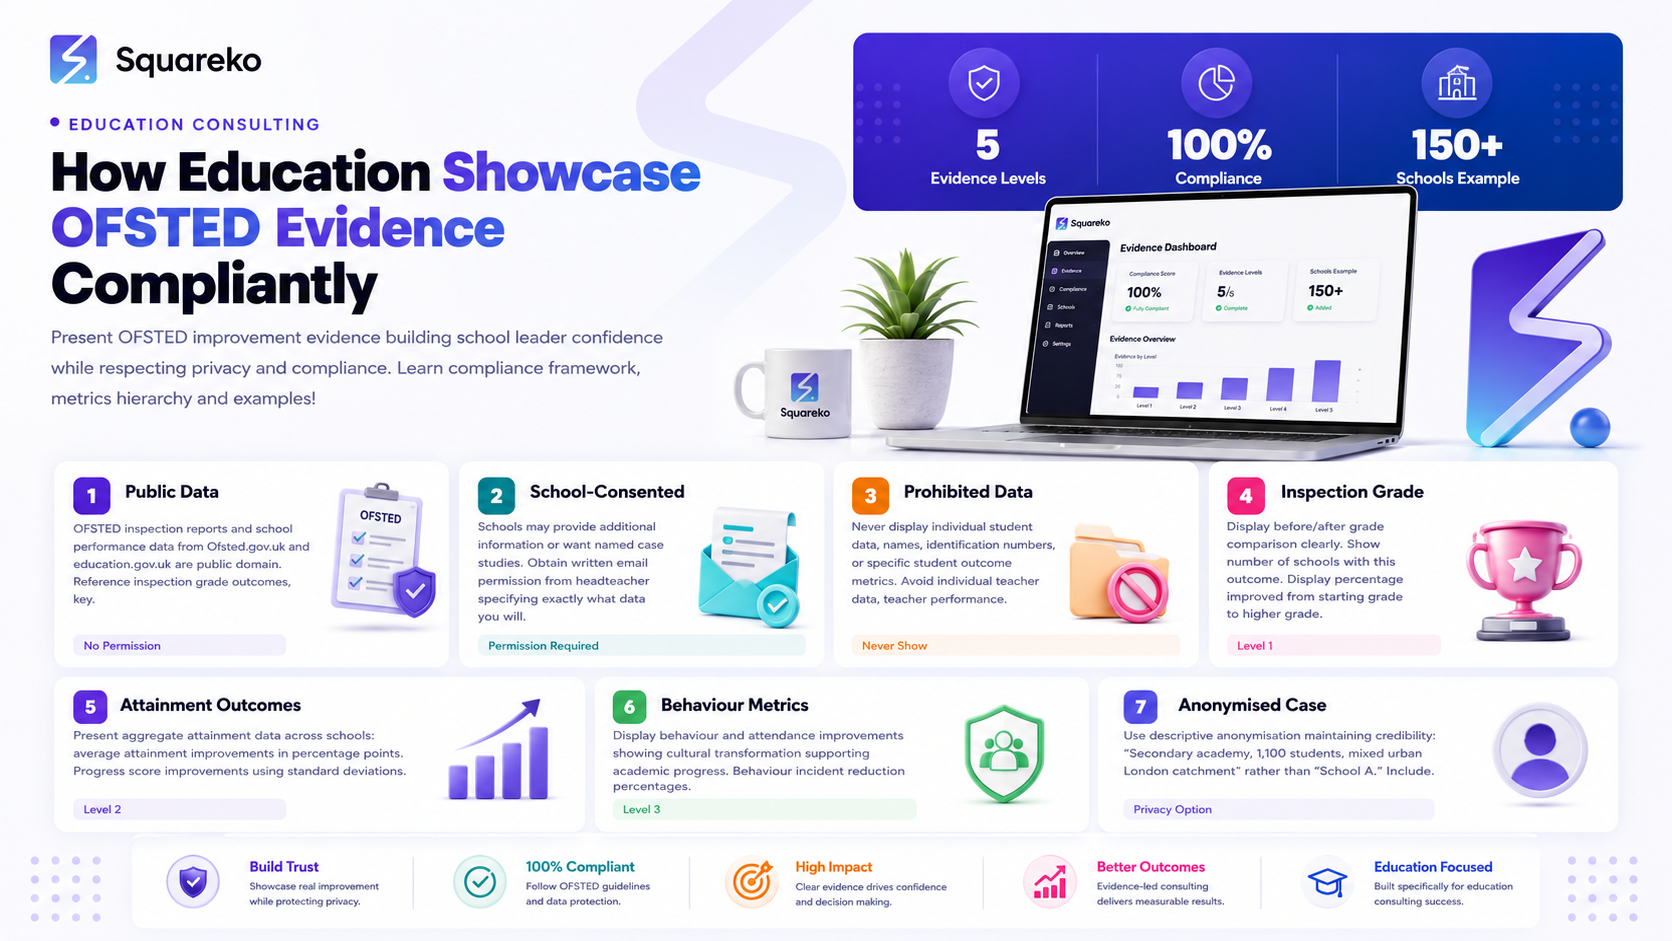
OFSTED improvement evidence should be presented in a clear hierarchy: inspection grade improvement (most important), followed by attainment metrics, progress scores, behaviour/attendance changes, and staff satisfaction—each level builds institutional credibility
Most school improvement evidence is publicly available through Ofsted reports and education performance data; presenting this public data compliantly is both effective and risk-free
Anonymised case studies ("secondary academy in London with mixed urban catchment") build trust when paired with specific metrics, while fully named case studies require explicit school permission but carry higher credibility
DfE association, government-commissioned work, and policy advisory roles signal institutional validation beyond individual school outcomes
Squarespace's native comparison blocks, data display sections, and structured tables allow professional OFSTED evidence presentation without custom coding
School leaders facing OFSTED inspection demand proof. Not testimonials, not case studies without metrics, not vague claims of "school improvement experience." They need documented evidence: inspection grade improvement, attainment gains, behaviour metrics, attendance changes—visible, verifiable, specific.
Yet most education consultant websites present OFSTED evidence carelessly, risking compliance issues while failing to build institutional credibility. They display school names without permission, reveal student-level data they shouldn't, or keep evidence so anonymised it loses credibility entirely.
Squarespace provides powerful tools for presenting OFSTED evidence that builds school leader confidence while respecting privacy and compliance boundaries. This post shows how to structure OFSTED evidence display, navigate the permission and privacy landscape, and create institutional impact hierarchies that move headteachers and governors from interest to qualified lead.
OFSTED Evidence Compliance and Privacy Framework
Understanding what evidence you can and cannot display is the foundation of compliant OFSTED evidence presentation. The framework has three layers: publicly available data, school-consented data, and prohibited data.
Publicly Available OFSTED Data (No Permission Required)
OFSTED inspection reports and school performance data published on Ofsted.gov.uk and education.gov.uk are in the public domain. You can reference this data without requesting school permission:
Inspection grade outcomes: "Improved from 'Requires Improvement' to 'Good' in the 2022 inspection"
Key inspection findings: References to Ofsted's published inspection judgement wording
Publicly reported metrics: Attainment scores published in school performance dashboards, progress measures published in education data dashboards, behavior and attendance metrics published in school accountability metrics
If you want to feature a school by name, verify the data comes from publicly published sources (Ofsted report, education performance dashboard, government statistics). If the source is public, you can reference it without additional permission.
School-Consented Data (Written Permission Required)
Schools may provide you additional information not in public sources, or you may want to name a school where you don't have explicit permission for public sources. In these cases, obtain written permission:
Email from headteacher or governor explicitly consenting to named case study publication
Specify exactly what data you'll include (school name, inspection outcome, attainment improvement, etc.)
Document that permission is current (obtain annually if needed)
Prohibited Data (Never Display)
Never display these categories of information regardless of consent:
Individual student data: Names, identification numbers, specific student outcome data, or any information that could identify individual students
Individual teacher data: Teacher names, specific teaching metrics, or teacher performance data
Financial information: School budget details, specific financial investments, or funding information
Safeguarding or pastoral information: Information about vulnerable pupils, behavior incident details, or safeguarding concerns
This data is protected by GDPR, FERPA-equivalents, and professional ethics. Never display it.
Impact Metrics Hierarchy for School Improvement
OFSTED evidence carries different weights in school leader decision-making. Structure your evidence in a clear hierarchy with most compelling evidence most prominent:
Level 1: Inspection Grade Improvement (Most Powerful)
Inspection grade improvement is the single most credible evidence for school improvement consultants:
Display Format:
Before/after grade comparison
Number of schools with this outcome
Average timeframe for improvement (e.g., "average 18 months from engagement to inspection")
Percentage of schools moving from their starting grade to a higher grade
Example Display: "150+ Schools Supported
63% moved from 'Requires Improvement' to 'Good' or 'Outstanding'
22% moved from 'Good' to 'Outstanding'
Average timeline: 18 months from engagement to improved inspection grade"
This evidence speaks to school leaders' primary concern: inspection improvement within realistic timescales.
Level 2: Attainment and Progress Metrics (High Credibility)
Attainment improvements (percentage of students meeting expected standard) and progress scores (value-added measures) demonstrate sustained academic impact:
Display Format:
Average attainment improvement across schools (percentage point gain)
Average progress score improvement (standard deviation or national comparison)
Percentage of schools achieving progress measure targets
Key stage specific improvements (KS2 attainment, KS4 attainment, KS5 value-add)
Example Display: "Student Outcomes Impact
Average attainment improvement: 7.2 percentage points across schools
Average progress measure improvement: +0.38 standard deviations
78% of schools achieved expected progress measure targets within 24 months"
These metrics demonstrate that school improvement translates to measurable student outcome gains, not just inspection grade movement.
Level 3: Behaviour and Attendance Metrics (Supporting Evidence)
Behaviour and attendance improvements provide evidence of whole-school culture improvement supporting academic progress:
Display Format:
Average behaviour incident reduction (percentage decrease)
Average attendance improvement (percentage point gain)
Percentage of schools achieving behaviour/attendance targets
Exclusion rate changes (if applicable)
Example Display: "School Culture Impact
Average attendance improvement: 2.4 percentage points
Average behaviour incidents reduced by 18%
Schools report 34% reduction in low-level classroom disruption within 6 months"
These metrics support the narrative that academic improvement is grounded in cultural transformation.
Level 4: Staff Professional Development and Satisfaction (Building Evidence)
While not directly measurable like inspection grades, staff satisfaction and professional development metrics indicate sustainable change:
Display Format:
CPD participation rates (percentage of staff engaging with professional development)
Staff confidence in teaching approach (pre/post survey)
Staff retention metrics (if improved)
Teacher professional development hours delivered
Example Display: "Professional Development Impact
Average teacher engagement in CPD: 94% across schools
Staff confidence in curriculum implementation: 67% pre-engagement, 89% post-engagement
Staff retention improved by average 12 percentage points among key staff members"
Level 5: Qualitative Feedback and Testimonials (Context-Setting Evidence)
Headteacher and governor testimonials provide context and credibility around quantitative metrics:
Display Format:
Brief, attributed testimonials from headteachers or governors
Specific, action-focused language ("They helped us improve from Requires Improvement to Good within 18 months")
Role attribution ("Rebecca Johnson, Headteacher, London")
This hierarchy ensures your most compelling evidence appears most prominently, with supporting evidence adding credibility layers.
Presenting Inspection Grade Improvements Compliantly
Inspection grade improvement is your strongest evidence category. Present it clearly and compliantly.
Before/After Comparison Display
Use Squarespace's native comparison block or table feature to show grade progression:
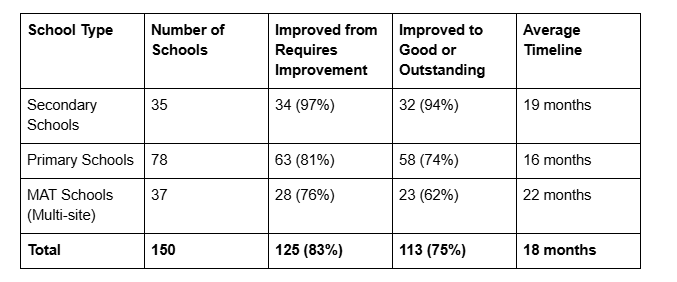
This table clearly shows your impact across different school types and contexts, building confidence in your methodology's effectiveness.
Geographic Distribution Display
School leaders want to know you've worked with schools in their region. Display geographic data:
"Schools We've Supported by Region (Past 3 Years)"
London: 28 schools supported, 22 improved inspection grades
South East: 34 schools supported, 26 improved inspection grades
East Anglia: 18 schools supported, 15 improved inspection grades
Midlands: 32 schools supported, 24 improved inspection grades
North West: 19 schools supported, 14 improved inspection grades
Yorkshire: 12 schools supported, 9 improved inspection grades
South West: 7 schools supported, 5 improved inspection grades
This geographic breakdown signals you understand regional education contexts and have track record locally.
Timeframe Transparency
School leaders want realistic expectations. Display improvement timeframes clearly:
"Inspection Grade Improvement Timeline
Based on 150 school engagements:
6-12 months: Initial compliance and basic improvement areas addressed
12-18 months: Measurable academic progress and behaviour culture improvement
18-24 months: Inspection-grade improvement typically observed
24+ months: Sustained improvement embedded in school systems
Individual school timelines vary based on starting position, staff capacity, and external factors. We provide monthly progress tracking against agreed targets."
This transparency builds credibility with school leaders who understand improvement isn't instantaneous.
Attainment, Progress, and Outcome Data Display
Attainment and progress metrics translate inspection improvement into student outcome gains, addressing the ultimate concern: are students learning more?
Aggregate Attainment Improvement
Present aggregate attainment data across schools:
"Student Attainment Impact Across Schools We've Supported
KS2 Average Attainment Gain: +7.8 percentage points (percentage of students meeting expected standard)
Schools starting below floor targets: average improvement +12.4 percentage points
Schools starting at floor targets: average improvement +6.2 percentage points
Schools starting above floor targets: average improvement +3.1 percentage points
KS4 Average Attainment Gain: +6.4 percentage points (percentage achieving Grade 5 or above in English and Mathematics)
Schools with disadvantaged catchments: average improvement +8.7 percentage points
Schools with mixed catchments: average improvement +5.9 percentage points
Schools with advantaged catchments: average improvement +2.3 percentage points"
This data shows you produce meaningful attainment gains across different starting contexts and school demographics.
Progress Measure Improvements
Progress measures (value-added scores) demonstrate that student learning gains hold even for students with lower prior attainment:
"Student Progress Score Improvements
KS4 Progress 8 Measure (schools supported):
Average Progress 8 improvement: +0.32 standard deviations
68% of schools improved Progress 8 measure within 24 months
Greatest improvement among disadvantaged student cohorts: +0.41 standard deviations
KS2-KS4 Value-Added Measures:
Schools show consistent progress measurement improvement across key stages
Particular strength in progress for students with lower prior attainment"
Progress measures are complex for many school leaders but signal that improvement benefits all student cohorts, not just those most able.
Subject-Specific Improvements
If you specialise in particular subjects or phase improvements, display subject-specific data:
"Subject-Specific Attainment Improvements (Secondary Schools)
English: Average improvement +6.2 percentage points
Particularly strong for girls and students in G7-8 attainment band
Mathematics: Average improvement +7.8 percentage points
Strongest improvements for students with prior attainment G5-6
Science: Average improvement +5.4 percentage points
Improvements strongest in secondary schools with prior weak physics provision"
Subject specificity builds confidence that your approach addresses subject-particular challenges, not just generic improvement.
Anonymised Case Study Strategy for Schools
Most school leaders understand that schools require confidentiality. Anonymized case studies remain powerful when paired with specific metrics and contextual detail.
Effective Anonymisation Structure
Rather than fully anonymizing schools (losing all context), use descriptive anonymization:
"Secondary Academy: Urban London Catchment, Mixed Attainment Starting Point"
Instead of: "School A"
Full Case Study Example:
Institution: Secondary academy, 1,100 students, mixed urban London catchment, serving diverse student population including 65% students with English as additional language
Challenge: OFSTED Requires Improvement (previous inspection), particularly weak curriculum coherence, low attainment in core subjects (EBacc pass rate 32%, well below national floor), behaviour concerns with higher-than-national fixed-term and permanent exclusion rates
Engagement: 8-month engagement focusing on (1) coherent KS3-KS4 curriculum design aligned to research-backed sequencing, (2) assessment and feedback implementation, (3) behaviour management and restorative practices staff development
Outcomes:
Inspection improvement: Moved to 'Good' within 18 months
Attainment improvement: EBacc pass rate 54% (+22 percentage points)
Progress measure improvement: Progress 8 improved from -0.28 to +0.16 (+0.44 standard deviations)
Behaviour improvement: Fixed-term exclusions reduced from 156 to 94 (39% reduction), permanent exclusions eliminated
Staff engagement: Teacher satisfaction with curriculum coherence improved from 28% confident to 84% confident
This level of descriptive anonymisation maintains privacy while providing enough context for school leaders to assess relevance and credibility.
Named Case Studies and Permission Architecture
Named case studies carry significantly higher credibility than anonymised examples. When schools permit named case studies, they're providing independent verification of your claims.
Permission Obtaining Process
Send schools this template email after successful engagement:
Subject: Case Study Collaboration for [School Name]
Dear Headteacher/Senior Leader,
We're proud of the school improvement work we've completed at School Name over the past timeframe. Your school's journey from previous grade to current grade, combined with specific measurable outcomes, demonstrates the kind of transformative improvement we help schools achieve.
With your permission, we'd like to feature School Name's improvement story as a case study on our website. This would include:
Your school name and brief context (e.g., secondary academy in London)
OFSTED grade improvement (from [X] to [Y])
Specific outcome metrics (e.g., attainment improvement, attendance gains, staff development impact)
A brief quote from your leadership team (optional)
Contact information for schools interested in speaking with you as a reference (optional)
Named case studies help other schools understand the realistic outcomes possible through systematic school improvement, and they help prospective clients verify the quality of our work.
This case study would appear on our website for a timeframe: typically 12-24 months. You can request removal at any time.
Would you be willing to participate? Please let me know if you'd like to discuss what the case study would include.
Best regards,
Permission Documentation
Once a school agrees, document the agreement:
Email confirmation from headteacher/leader explicitly approving case study publication Specific approval of data included (school name, grade improvement, metrics to be featured) Contact information shared by school (optional) for other schools to contact as reference Annual confirmation that permission remains current (if maintaining long-term case studies)
Keep this documentation accessible for compliance purposes.
DfE Association and Institutional Validation Display
Government association and policy advisory roles signal institutional validation beyond individual school outcomes.
DfE and Policy Advisory Positioning
If you hold or have held DfE-related roles, display these prominently:
"Policy Advisory Experience"
Department for Education advisor on school improvement strategy (2021-2023)
School improvement network member, National College for Educational Leadership
Expert contributor, Education Endowment Foundation research on improving secondary school outcomes
Speaking engagement, OFSTED conference on sustained school improvement (2024)
These roles signal that your methodology isn't proprietary but validated through government and research institution review.
Government-Commissioned Project Display
If you've led government-commissioned projects or research, feature these:
"Government-Commissioned Work"
Led evaluation of school improvement intervention across 40 secondary schools for [Local Authority/Government Program]
Outcomes: Average 1.2-grade improvement within 18 months, 18-point average attainment gain
Results published in [Government Report/Research Publication], available at link
Government-commissioned work carries authority because third parties have vetted your methodology and results.
Professional Association Leadership
Active membership in and leadership within professional associations signals peer recognition:
"Professional Recognition"
ASCL (Association of School and College Leaders) member
TES Consulting network featured consultant
Regional education network leadership position
Squarespace Implementation for Evidence Display
Homepage Impact Showcase Section
Feature your key statistics prominently on your homepage:
Use Squarespace's Comparison Block or Image Block with Text Overlay to display:
"150+ Schools Supported 63% Improved from Requires Improvement to Good/Outstanding Average Improvement Timeline: 18 Months Average Student Attainment Gain: 7.4 Percentage Points"
This above-the-fold evidence immediately signals school leader credibility.
Dedicated "Our Impact" Page
Create a page specifically for impact evidence display featuring:
Impact Metrics Section: Comparison tables showing grade improvement, attainment gains, behaviour metrics
Timeline and Sustainability Section: How improvements are sustained beyond initial engagement
Case Studies Section: Links to 3-5 detailed case study pages
Professional Recognition Section: DfE roles, advisory positions, thought leadership
Case Study Page Architecture
Create individual pages for each case study following this structure:
Header: School type and context descriptor
The Challenge: 2-3 paragraph problem description
Our Approach: How you worked with the school
Results: Before/after metrics in clear comparison format
Quote: Optional testimonial from school leader
Sustainability: How improvements have been maintained
Use Squarespace's native table blocks for metrics comparison and image blocks for visual evidence (charts, graphs showing improvement over time).
Frequently Asked Questions
-
A: If all information comes from publicly published sources (Ofsted report, education performance dashboard), you can reference the school by name without additional permission. However, in practice, most schools prefer you request permission before publishing their name and data—even though legally you may not need it. Requesting permission is relationship-protective and demonstrates professional respect.
-
A: Feature case studies from the past 3-5 years. Older case studies may represent outdated methods or evidence. If you have exceptional case studies from earlier periods, you can feature them but contextualize: "This 2018 improvement programme demonstrates the sustained impact of our methodology—this school has maintained its Good grade and improved attainment further in subsequent inspections."
-
A: Respect their request. Present the case study anonymously with full descriptive detail (school type, phase, context, size, location region) and specific metrics. The anonymity is ethically correct and doesn't significantly diminish credibility if metrics are specific and impressive.
-
A: Display both contextually. For inspection grades, use before/after grades (Requires Improvement → Good). For attainment, use percentage point improvements (27% to 34% = +7 percentage points). For progress measures, use standard deviations (+0.32 SD improvement). Different metrics serve different audiences—headteachers understand percentage points; governors understand grade movement.
-
A: Use language like: "Based on 150 school engagements, the average timeline to inspection grade improvement is 18 months, though individual school timelines vary. Schools starting from Requires Improvement typically improve within 18-24 months; schools with more advanced starting positions may require 24+ months to achieve Outstanding."
This frames timelines as data-informed averages, not guarantees, while showing realistic expectations.

From custom website design to SEO strategy, we help businesses launch a site that looks professional and performs better.

Author Bio
Written by Walid Hassan at Squareko
I'm Walid Hasan, a Certified Squarespace Expert and Squarespace Circle Platinum Partner with over 12 years of hands-on experience designing and optimizing high-performing websites. Over the years, I've had the privilege of building more than 2,000 Squarespace websites for clients around the world, always focusing on clean design, strong user experience, and conversion-driven results.