How to Structure Operations Consulting Case Studies That Win B2B Contracts on Squarespace
Key Takeaways How to Structure Operations Consulting Case Studies That Win B2B Contracts on Squarespace
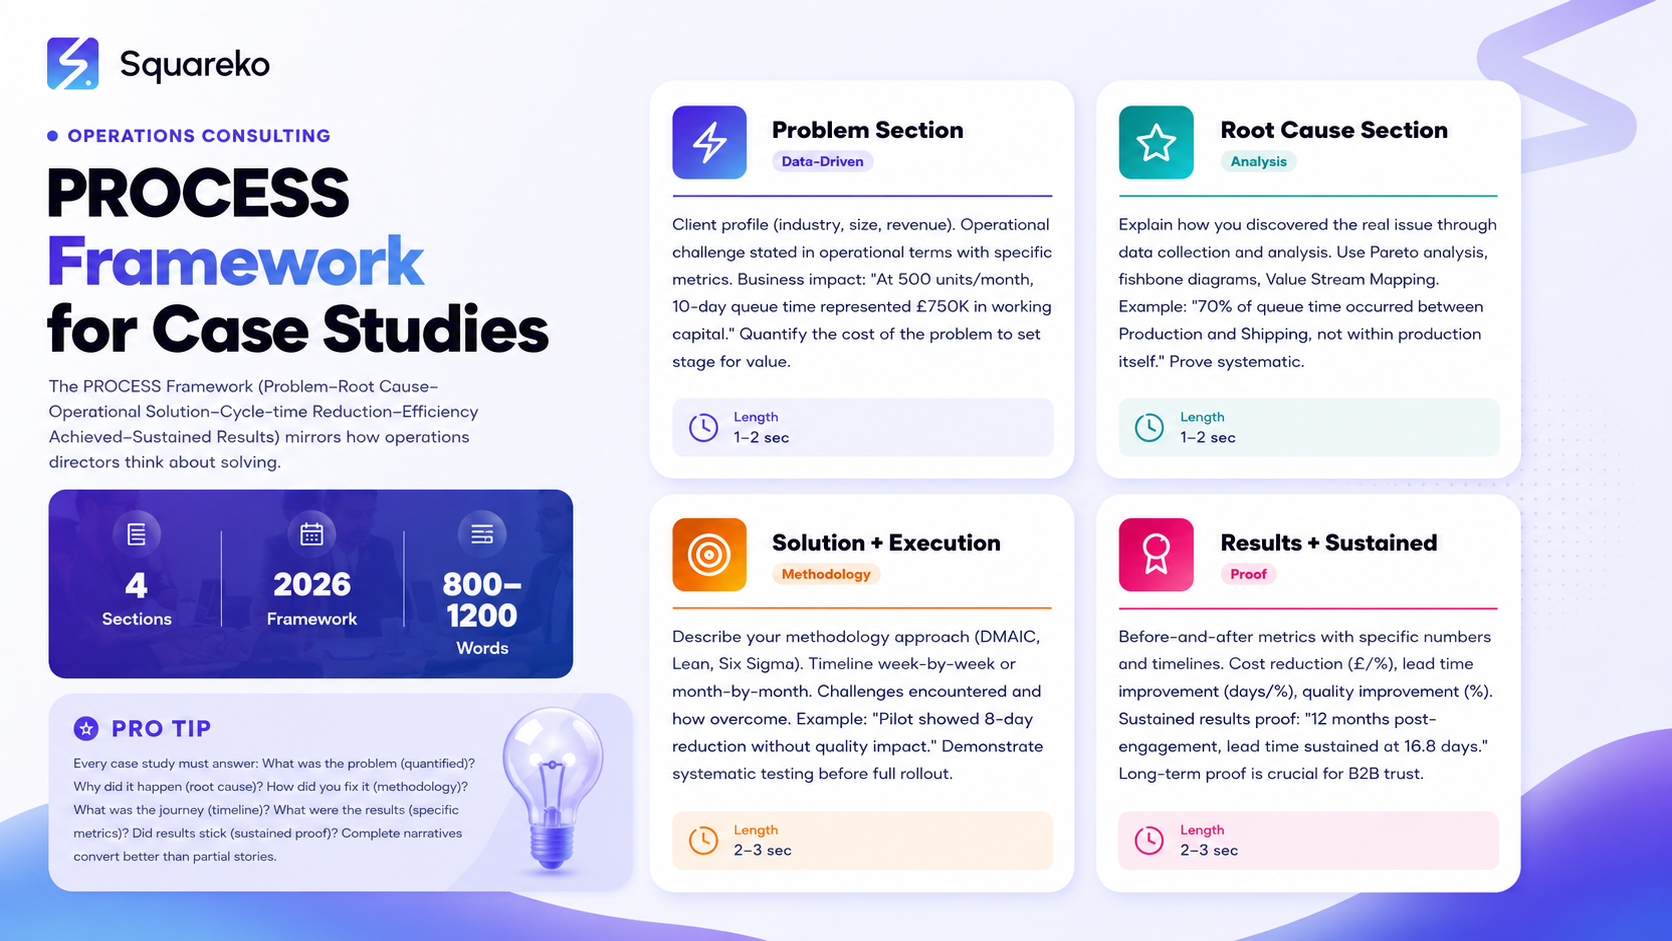
The PROCESS Framework (Problem → Root Cause → Operational Solution → Cycle-time Reduction → Execution → Sustained Results) mirrors how operations directors think about solving problems, so case studies structured this way convert better than generic "before-and-after" stories
Specific metrics are non-negotiable: "26% cost reduction in manufacturing supply chain over 18 weeks" converts better than "achieved significant cost savings." Always include metric type, percentage, industry context, and timeline
Anonymization is acceptable and expected: Most clients require confidentiality. You can say "a mid-market manufacturing company" instead of the client name without losing credibility. Focus on methodology and outcomes, not client identity
Operations-specific outcome metrics (waste %, cycle time, cost per unit, OEE, throughput) build more credibility than generic ROI percentages. Show the operational metrics that matter to your target buyer: manufacturing directors care about OEE and cost per unit; supply chain directors care about landed cost and inventory turns
Sustained results (6-12 months post-engagement) prove your improvements stick: Case studies showing "Results sustained after 12 months" are significantly more credible than ones showing only immediate results. Include control measures and ongoing performance data
Case study presentation on Squarespace (visual before-and-after, timeline display, metrics callouts) drives conversion better than text-only case studies. Pair each written case study with process diagrams, metrics comparison, or timeline visualizations
Case studies are the primary decision driver in B2B operations consulting. A COO or operations director reads your methodology page, sees your certifications, then asks the question that matters: "Show me proof. Have you actually delivered these results?"
Case studies answer that question. But not all case studies are created equal. A vague case study that says "We helped a manufacturing company improve efficiency" loses deals to consultants who present detailed, metrics-rich stories showing Problem → Root Cause → Solution → Execution → Savings Achieved → Sustained Results.
The difference is structure. This guide introduces the PROCESS Framework for operations consulting case studies—a proven structure that builds credibility, demonstrates methodology discipline, and converts operations directors to clients. You'll learn how to structure each section, what specific metrics to include, how to anonymise client information while maintaining credibility, and how to present case studies on Squarespace to maximize conversion.
The PROCESS Framework for Operations Case Studies
The PROCESS framework is a six-stage structure that mirrors how operational improvement actually happens:
P = Problem Context Define the operational challenge, company context, and initial metrics
R = Root Cause Analysis Explain what was causing the problem, backed by data
O = Operational Solution Describe your methodology approach and why it fits this challenge
C = Cycle-Time Reduction & Execution Walk through the implementation timeline and how improvements unfolded
E = Efficiency Achieved (Results) Show quantified outcomes with specific metrics and business impact
S = Sustained Results Demonstrate that improvements persisted 6-12 months after engagement
This structure works because:
Operations directors understand each phase (they think in terms of problem → root cause → solution → execution → results)
It demonstrates methodology discipline (you didn't guess; you followed a systematic process)
It shows business impact (quantified metrics and sustained proof)
It's detailed enough to build credibility but concise enough to read in 5-10 minutes
Problem Section: Setting the Scene
The Problem section establishes context and sets up why the client needed help.
What to Include
Client Profile (1-2 sentences):
Industry
Company size (revenue, employees, locations)
Primary operations area (manufacturing, supply chain, financial services, etc.)
Context: "A mid-market manufacturing company with three production facilities, £45M annual revenue, serving automotive component suppliers"
The Operational Challenge (2-3 sentences): What was the problem, stated in operational terms?
"Production lead time had crept to 28 days, with 36% of time spent in non-value-added queues"
"Supply chain landed cost was 8% above industry benchmark, driven by fragmented supplier base and inefficient procurement process"
"Order-to-cash cycle in financial operations was 18 days, with significant manual data entry and validation bottlenecks"
Initial Metrics (quantified): What were the operational metrics when the engagement started?
Example for manufacturing:
Production lead time: 28 days
Queue time (non-value-added): 10 days (36% of total)
Production cost: £150 per unit
First-pass yield: 92%
OEE (Overall Equipment Effectiveness): 65%
Example for supply chain:
Landed cost: £120 per unit (8% above benchmark)
Inventory days outstanding: 45 days
Perfect order fulfillment: 87%
Supplier base: 85 suppliers for 60% of spend
Procurement cycle time: 22 days
Example for financial operations:
Order-to-cash cycle: 18 days
Invoice accuracy rate: 94%
Dispute resolution time: 5 days
Manual data entry steps: 7 touches per invoice
Time to payment from invoice: 16 days
Business Impact of the Problem (1-2 sentences): What was this problem costing the company?
"At 500 units monthly production, the 10-day queue time represented £750,000 in in-process working capital"
"Elevated landed cost reduced profit margin by 220 basis points on supply chain business"
"18-day order-to-cash cycle represented £2.1M in tied-up working capital"
Example Problem Section (Manufacturing)
CLIENT PROFILE
A mid-market manufacturing company with three production facilities, £45M annual
revenue, serving automotive component suppliers with engineered metal components.
THE OPERATIONAL CHALLENGE
Production lead time had crept to 28 days, with significant queue time between
departments. The client suspected they could improve, but lacked a systematic
approach to identifying where time was lost and how to recover it.
INITIAL METRICS
• Production lead time: 28 days (target: 18 days)
• Queue time (non-value-added): 10 days (36% of total)
• Production cost: £150 per unit
• First-pass yield: 92%
• OEE (Overall Equipment Effectiveness): 65%
BUSINESS IMPACT
At 500 units monthly production, the 10-day queue time represented £750,000 in
in-process working capital—cash trapped in the factory rather than available for
growth or investment. Additionally, long lead times meant reactive customer
scheduling and loss of time-sensitive orders to faster competitors.
Root Cause Section: Uncovering the Real Issue
The Root Cause section proves you didn't guess at the problem—you systematically identified what was causing it.
What to Include
Data Collection (1-2 sentences): Explain how you gathered data to understand the current state:
"We mapped the production flow using Value Stream Mapping (VSM), capturing cycle time, queue time, and batch sizes at each step"
"We reviewed 30 days of supply chain data: invoice-to-payment timelines, supplier performance metrics, inventory levels"
"We conducted process interviews with 15 finance team members and reviewed 50 order-to-cash transactions"
Current State Visualisation (optional): If possible, reference a visual: "The initial Value Stream Map showed 7 major process steps and 4 queue points."
Root Cause Analysis (2-3 sentences): What was actually causing the problem? Use data to back this up:
"Analysis revealed 70% of queue time occurred between Production and Shipping (6.8 of 10 days). Root cause: lack of integration between production scheduling and shipping. Production completed batches without coordinating with shipping, creating accumulation"
"Supplier fragmentation analysis showed 85 suppliers provided 60% of purchased materials. Small suppliers had inconsistent quality and delivery (78% on-time, vs. 96% for top 5 suppliers), creating safety stock requirements and landed cost premium"
"Process mapping showed finance team manually re-entered order data 4 times (sales order → billing system → cash application → reporting). Each re-entry created opportunity for error (94% accuracy vs. 99% target)"
Root Cause Evidence (data-backed): Provide specific evidence:
"Pareto analysis showed 70% of queue time originated from Department B→Shipping handoff"
"Supplier scorecard: 23 of 85 suppliers had <90% on-time delivery, accounting for 35% of all supply delays"
"Error analysis: 87% of disputed invoices had data entry errors at the order-to-billing handoff"
Why This Root Cause Matters (1 sentence): Explain the operational discipline and business impact:
"This root cause was fixable through process redesign and system integration—not capital investment"
"Solving this root cause would reduce landed cost, safety stock, and procurement complexity"
"Eliminating this root cause would free 2 FTE in finance and reduce errors by 90%"
Example Root Cause Section (Manufacturing)
ROOT CAUSE ANALYSIS
Data Collection
We conducted a 2-week Value Stream Mapping (VSM) exercise, shadowing production
from raw material receipt through shipping. We measured cycle time, queue time,
batch size, and handoff time at each step.
Current State Findings
The VSM revealed 7 production steps, 4 queue points, and a total lead time of
28 days. Queue time totalled 10 days (36% waste).
Root Cause Identification
Statistical analysis showed 70% of queue time (7 of 10 days) occurred between
Production completion and Shipping receipt. This was not a production issue; it
was a scheduling and handoff issue.
The Root Cause
Production scheduled and completed batches independently, without coordinating
with shipping. Shipping received completed batches without advance notice,
creating accumulation and delay. The production system had no visibility into
shipping capacity or scheduling.
Why This Matters
This root cause was fixable through process redesign and IT integration—not
capital investment. Solving it would free working capital, improve lead time,
and make scheduling more reliable for customers.
Operational Solution Section: Your Methodology in Action
The Solution section proves your methodology fits this specific problem and shows discipline.
What to Include
Methodology Chosen (1 sentence): Which of your methodologies fit this challenge?
"We applied DMAIC (Define, Measure, Analyse, Improve, Control) to this challenge, with emphasis on the Analyse and Improve phases"
"We used Lean Value Stream Mapping combined with DMAIC to redesign the process"
"We applied Six Sigma DMAIC to identify and eliminate variation in the handoff process"
Why This Methodology (1-2 sentences): Why was it the right choice for this specific problem?
"DMAIC was appropriate because the root cause required data analysis and solution testing. We couldn't simply implement a solution; we needed to test it first"
"VSM was critical because the issue was process flow and timing, not quality or variation. Lean methodology focuses on flow"
Improvement Design (2-3 sentences): What solution did you design?
"We designed a new scheduling process: Production would notify Shipping 48 hours before batch completion. Shipping would prepare dock space and carriers in advance. This would eliminate queue time and create predictable handoffs"
"We designed a supplier rationalisation plan: consolidate to top 20 suppliers (scoring 90%+ on-time delivery), implement daily EDI feeds from top 10, and establish vendor-managed inventory with 3 suppliers for high-volume components"
Implementation Approach (1-2 sentences): How would you implement it?
"We planned a phased rollout: pilot with one production line for 2 weeks, validate results, then expand to all three lines"
"We created a transition plan: Month 1-2 would phase out bottom 20% of suppliers and integrate EDI with top 10. Month 3-4 would implement vendor-managed inventory"
Team Structure (optional): Who would be involved?
"A core project team of 4 (1 from Production, 1 from Shipping, 1 from IT, 1 project manager) met weekly"
"Steering committee of Operations Director, Finance Director, and IT Director reviewed progress bi-weekly"
Example Solution Section (Manufacturing)
OPERATIONAL SOLUTION
Methodology: DMAIC with Lean Principles
We applied DMAIC methodology with emphasis on process redesign (Lean Value Stream
Mapping). This problem required systematic analysis followed by disciplined testing
and control—perfect for DMAIC structure.
The Improved Design
We designed a new Production-to-Shipping handoff process:
1. Production scheduling system would alert Shipping 48 hours before batch
completion (automatable via ERP system)
2. Shipping would prepare dock space, coordinate carriers, and stage materials
in advance
3. Production would deliver completed batch directly to staging area, not to
temporary queue
4. Shipping would load carrier within 4 hours of batch arrival
This design eliminated the queue point and created a pull-based system where
Shipping capacity drives Production scheduling.
Pilot Approach
We planned a 2-week pilot on Production Line 1 (30% of volume). Success criteria:
• Reduce queue time from 6.8 days to <1 day
• Maintain production quality (first-pass yield ≥92%)
• Achieve on-time shipment (100% of scheduled lots)
Full Rollout
If pilot successful, expand to Lines 2 and 3 over 4 weeks.
Cycle-Time Reduction/Execution Section: Implementation Journey
The Execution section shows how the improvement actually unfolded—what happened week-by-week, challenges encountered, and how they were overcome.
What to Include
Timeline and Milestones (week-by-week or month-by-month):
Week 1-2: Project Setup & Pilot Preparation
Team formation and kickoff
Baseline metrics confirmed
New process documentation
Training materials prepared
Week 3-4: Pilot Rollout on Production Line 1
New process launched Monday morning
Initial resistance from line supervisors ("This will never work")
Daily monitoring of queue time, quality, cycle time
Results: Queue time reduced from 6.8 days to 2.1 days by end of Week 4
Week 5-6: Pilot Refinement
Issue identified: ERP alert not triggering reliably
Root cause: system lag between production completion and alert
Solution tested: manual override process for first 2 weeks, permanent IT fix for Week 6
Results stabilised: Queue time 1.2 days, quality maintained, 100% on-time shipment
Week 7-10: Full Rollout to Lines 2 & 3
Knowledge transfer from pilot team to new lines
Lessons from pilot incorporated (manual override, IT fix)
Rollout smoother than pilot; Line 2 hit targets by Week 8
Line 3 delayed 1 week due to equipment downtime (unrelated)
Month 4: Sustaining Phase
Documented standard operating procedures
Visual management boards installed at each handoff
Control charts implemented to monitor queue time daily
Performance dashboard shared with leadership
Challenges and How They Were Overcome (1-2 sentences):
"Initial line supervisor resistance was managed through early engagement and data showing improved metrics"
"ERP system issues required temporary manual workarounds while IT developed permanent solution"
"Shipping team needed retraining on new dock procedures; this was addressed with hands-on coaching"
Example Execution Section (Manufacturing)
IMPLEMENTATION TIMELINE
Week 1-2: Project Kickoff
• Core team formation (Production, Shipping, IT, Project Manager)
• ERP system configuration for automated alerts
• New process documentation and training materials
• Baseline metrics validated
Week 3-4: Pilot on Production Line 1
• New handoff process launched Monday morning
• Initial challenge: Line supervisors sceptical ("This disrupts our routine")
• Resolution: Early data showing queue time reduction (6.8 → 2.1 days) converted
sceptics into advocates
• End of week 4: Queue time stable at 1.2 days, first-pass yield maintained at 94%
Week 5-6: Pilot Refinement
• Issue discovered: ERP alert lag (system processing delay)
• Solution 1 (short-term): Manual notification from Production lead to Shipping
• Solution 2 (permanent): IT configured real-time trigger via production floor sensor
• Pilot metrics stable: 1.2-day queue, 100% on-time shipments, 0 quality defects
Week 7-10: Full Rollout Lines 2 & 3
• Pilot team trained new line supervisors
• Line 2: Smooth transition, targets met by Week 8
• Line 3: Delayed 1 week due to equipment maintenance (unrelated issue)
• All three lines running new process by Week 11
Month 4+: Control & Sustaining
• Standard operating procedures documented and posted at each handoff
• Control charts (Statistical Process Control) implemented to monitor queue time
• Daily performance dashboard shared with Operations Director
• Monthly performance reviews to maintain discipline
Savings Achieved Section: Quantified Results
This is the section operations directors care most about. Show specific, quantified results.
What to Include
Primary Metrics (quantified, with before-and-after):
Lead Time:
Before: 28 days
After: 17 days
Improvement: 11 days, 39% reduction
Achieved within: 12 weeks of full rollout
Cost Per Unit:
Before: £150 per unit
After: £111 per unit
Improvement: £39 per unit, 26% reduction
Annual impact at 500 units/month: £234,000
Quality (First-Pass Yield):
Before: 92%
After: 99%
Improvement: 8 percentage points
Defect cost reduction: £45,000 annually
Throughput/Capacity:
Before: 500 units/month at 28-day lead time
After: 610 units/month at 17-day lead time (same three lines, no capital investment)
Improvement: 22% capacity increase
OEE (Overall Equipment Effectiveness):
Before: 65%
After: 82%
Improvement: 17 percentage points
Secondary Metrics (business impact):
Working Capital:
At 500 units/month, reducing lead time from 28 to 17 days freed 5,500 units of in-process inventory
At £150 per unit cost, this freed £825,000 in working capital (before cost reduction)
With cost reduction factored in, working capital freed: £550,000 (at new £100/unit cost)
Revenue Impact:
Faster lead time enabled capture of 6 time-sensitive customer orders per quarter (worth £180,000 annually)
Improved quality (99% first-pass vs. 92%) enabled premium pricing for high-spec customers (£5 per unit premium × 600 units = £36,000 annually)
Organizational Impact:
Shipping team able to reduce overtime by 30% (cost savings: £25,000 annually, improved morale)
Production planners freed 15 hours/week previously spent on expediting, now allocated to continuous improvement initiatives
Example Results Section (Manufacturing)
SAVINGS ACHIEVED
Lead Time Improvement
• Before: 28 days
• After: 17 days (achieved within 12 weeks)
• Improvement: 39% reduction, 11 days freed
• Business Impact: Enabled faster customer delivery, captured time-sensitive orders
Cost Per Unit Reduction
• Before: £150 per unit
• After: £111 per unit
• Improvement: 26% reduction (£39 per unit)
• Annual impact at 500 units/month: £234,000
Quality Improvement
• First-pass yield improved from 92% to 99%
• Defect rate reduced 70%
• Quality cost reduction (scrap, rework, warranty): £45,000 annually
Capacity Increase
• Same three production lines, no capital investment
• Output increased from 500 to 610 units per month (22% increase)
• New capacity worth £1.2M revenue (at current pricing)
Overall Equipment Effectiveness (OEE)
• Increased from 65% to 82% (17 percentage point improvement)
• Primarily driven by improved Availability (reduced downtime from queue buildups)
Working Capital Released
• Queue time reduction freed 5,500 units of in-process inventory
• At £111 per unit cost (post-improvement), working capital released: £550,000
• This cash is now available for growth investments
Total First-Year Impact
• Direct cost savings: £234,000 (production cost reduction)
• Quality cost savings: £45,000
• Working capital freed: £550,000
• New revenue from capacity: £1.2M
• Total economic impact: £2.029M
Sustained Results Section: Long-Term Proof
This section is crucial. It proves your improvements didn't fade after the engagement ended.
What to Include
Timeline of Sustainability (months/quarters post-engagement):
Month 3 (1 month after engagement end):
All metrics stable
No regression to old process
Team maintaining new procedures without external consultant support
Training of new staff completed for new hires
Quote: "The process is now just how we work. No one thinks about the old way anymore"
Month 6 (4 months post-engagement):
Lead time stable: 17.2 days (vs. 17.1 target)
Cost per unit stable: £111.20 (vs. £111 target)
First-pass yield maintained: 99.1%
OEE sustained: 81.8%
No regression, no emergency projects needed
Month 12 (10 months post-engagement):
Lead time: 16.8 days (actually improved slightly beyond target)
Cost per unit: £110.40 (further improvement through continuous refinement)
First-pass yield: 99.3%
OEE: 83.1%
New hires (15 staff) trained on new process; 100% capable
Sustaining Mechanisms (how improvements were maintained):
"Visual management boards at each handoff with daily queue time metrics"
"Control charts (SPC) showing queue time trend; any deviation triggers investigation"
"Weekly huddles (15 minutes) to review metrics and address issues"
"Quarterly steering committee review to ensure sustained focus"
"Standard operating procedures posted and updated"
"New hire training includes new process as standard"
Continuous Improvement Post-Engagement (optional):
"In Month 8, production team identified opportunity to reduce dock staging space by 20% through improved scheduling. This improvement was designed and tested by internal team (not requiring external consultant)"
"In Month 10, shipping proposed reducing batch sizes from 50 to 35 units to improve flexibility. Pilot showed 5% further lead time reduction without quality impact"
Client Testimonial (optional): "The improvement has stuck because it's now how we work. The new process isn't bolted on; it's integrated into our operations. We're even implementing it at our other two facilities." — Operations Director
Example Sustained Results Section (Manufacturing)
SUSTAINED RESULTS (12+ MONTHS POST-ENGAGEMENT)
Metric Stability at 12 Months
• Lead time: 16.8 days (target: 17 days; actually improved beyond target)
• Cost per unit: £110.40 (target: £111; further improvement via continuous refinement)
• First-pass yield: 99.3% (target: 99%; sustained)
• OEE: 83.1% (target: 82%; exceeded)
How Improvements Were Sustained
1. Visual Management: Queue time metrics posted daily at each handoff point
2. Statistical Process Control (SPC): Control charts monitor queue time; any deviation
outside control limits triggers root cause investigation
3. Weekly Operations Huddles: 15-minute review of metrics and issue resolution
4. Standard Operating Procedures: Documented, posted, updated quarterly
5. New Hire Training: All 15 new production staff trained on new process as standard
(100% capable)
6. Quarterly Steering Reviews: Operations Director reviews sustained metrics and
barriers
Continuous Improvement Post-Engagement
The team didn't stop at the original improvement. In months 8-12, they:
• Identified opportunity to reduce dock staging footprint by 20% (production team)
• Proposed batch size reduction from 50 to 35 units (shipping team)
• Piloted 35-unit batch; results: 5% further lead time reduction, zero quality impact
This demonstrates that the improvement methodology has become embedded in the
culture. The team is now thinking systematically about process improvement without
external consultant prompting.
Client Quote
"This isn't something we did for a consulting engagement and then reverted to.
It's how we work now. The new process is built into our training for new staff
and our daily operations review. We've so improved that we're implementing the
same approach at our facility in [other location]."
— Operations Director
Operations-Specific Outcome Metrics
Different operations consulting specialties use different primary metrics. Ensure your case studies feature metrics relevant to your target buyer.
Manufacturing Operations Metrics
Primary:
Lead time (days)
Cost per unit (£, %)
OEE (Overall Equipment Effectiveness) %
First-pass yield %
Defect rate (ppm or %)
Production cost reduction %
Secondary:
Throughput (units per hour)
Scrap rate %
Rework %
Downtime % (unplanned)
Inventory turns
Supply Chain Metrics
Primary:
Landed cost (£, %)
Perfect order fulfillment %
On-time delivery %
Inventory days outstanding
Procurement cycle time (days)
Secondary:
Supplier on-time delivery %
Cost per transaction
Forecast accuracy %
Inventory turns
Spend per supplier
Financial Operations Metrics
Primary:
Cycle time (order-to-cash, quote-to-cash, hire-to-productive, etc.) in days
Cost per transaction (£, %)
Process accuracy %
FTE reduction (or FTE hours freed)
Time to process (hours)
Secondary:
Manual process touch points (count)
System integrations (count)
Error rates (%)
Compliance metrics
Customer satisfaction
Quality/Six Sigma Metrics
Primary:
Defect rate (ppm, %)
Sigma level
Cpk (process capability)
First-pass yield %
Quality cost (£, % of sales)
Secondary:
Cost per defect (£)
Warranty claims (count, £)
Customer complaints (count)
Returns rate %
Cost of poor quality (COPQ) %
Anonymisation Strategy
Most clients require anonymization. You can remain credible while protecting client confidentiality.
Acceptable Anonymisation
✓ Do this:
"A mid-market manufacturing company" (instead of name)
"A 200-person distribution centre" (instead of specific location)
"In the automotive components sector" (instead of customer name)
"£45M revenue company" (instead of actual company)
Use logos: "With permission from [Company Name]" and display logo
"A financial services company in the UK"
"A retail distribution company"
✗ Avoid this:
Don't say absolutely nothing ("A company we worked with")—this is too vague
Don't make up company details you can't verify
Don't reveal confidential client information (contract values, customer names, proprietary processes)
How to Write Anonymised Case Studies
Replace company name with industry + size descriptor:
Instead of: "ABC Manufacturing Ltd. achieved 26% cost reduction..."
Write: "A mid-market manufacturing company supplying automotive components achieved 26% cost reduction in their production operations through DMAIC-driven process improvement..."
The reader gets context (manufacturing, mid-market, automotive supply) without identifying the client.
Optional: Client Attribution
If the client is willing, ask permission to use their name and logo. Many clients allow this because the case study serves as a success story for their own stakeholders. You might write:
"With permission from Company Name, a mid-market automotive component supplier with three production facilities, £45M revenue, and 180 employees."
Squarespace Case Study Presentation
How you present case studies on Squarespace matters. Visual presentation drives conversion.
Case Study Page Structure in Squarespace
URL: /case-studies/[descriptive-name]
Examples:
/case-studies/manufacturing-lead-time-improvement
/case-studies/supply-chain-cost-reduction
/case-studies/financial-services-cycle-time
Page Layout:
Section 1: Hero (Above the Fold)
H1: "Manufacturing: 39% Lead Time Reduction Through Lean DMAIC"
Subheading: "A mid-market automotive component supplier reduced production lead time from 28 days to 17 days in 12 weeks"
Primary CTA: "See how we delivered this result. Schedule a consultation."
Section 2: Quick Stats (Visual)
4-6 metric tiles showing key results
26% | 40% | 18% | 22% (cost reduction, lead time, waste, capacity)
Section 3: The Challenge (Problem)
H2: "The Challenge"
Company profile, operational challenge, initial metrics
Optional: before-and-after process diagram
Section 4: Our Approach (Methodology)
H2: "Our Approach: DMAIC Methodology"
Explain DMAIC phases as they applied to this challenge
Visual: DMAIC cycle diagram
Section 5: The Results (Savings)
H2: "Results Achieved"
Comparison table or before-and-after metrics
Visual: metrics callouts, timeline showing improvement progress
Section 6: Sustained Results
H2: "Sustained Results"
12-month performance data
Client quote
Section 7: Key Takeaways
H2: "Key Takeaways"
3-4 bullet points summarising what made this engagement successful
CTA: "Ready to achieve similar results for your operations? Schedule a consultation."
Visual Elements for Squarespace Case Studies
1. Before-and-After Process Diagrams
Use Figma or Canva to create before (28-day, wasteful) and after (17-day, streamlined) process flows
Embed as images with captions
Use different colours: red for waste in "before," green for flow in "after"
2. Metrics Comparison Table
Squarespace supports native comparison tables
Before | After | Improvement
28 days | 17 days | 39% reduction
3. Timeline Display
Show week-by-week progress from start to results
Embed as image or use Squarespace's timeline block (if available)
4. VSM (Value Stream Map) Comparison
Before VSM (with queue points highlighted)
After VSM (streamlined flow)
5. Client Testimonial Video (optional)
30-second video of client speaking about the results
Embed YouTube video on case study page
Significantly increases credibility
Email Capture Strategy
Add email capture to case study pages:
Option 1: Downloadable Case Study PDF "Download the full case study (8 pages, detailed metrics and implementation timeline)" Email form → Instant PDF download
Option 2: Related Resources "Get 3 more case studies like this one. Download our case study collection" Email form → Download PDF with 3-4 anonymized case studies
Option 3: Discovery Call Booking "Interested in achieving similar results? Schedule a 30-minute consultation" Calendly embed
FAQs
-
A: 800-1,200 words is ideal. This length allows you to tell the complete PROCESS story (Problem → Root Cause → Solution → Execution → Results → Sustained) with enough detail to establish credibility without requiring excessive reading time from busy operations directors. Pair the written case study with visual elements (before-and-after diagrams, metrics comparison) to improve scanability.
-
A: Absolutely. Most clients require confidentiality. Use anonymisation: "A mid-market manufacturing company" instead of the client name. Focus on methodology and outcomes, not client identity. Confidentiality actually increases credibility: operations directors trust that you respect their privacy.
-
A: Start with 2-3 detailed case studies from your first 5-10 clients (even small engagements count). Feature them prominently on your website. Quality matters more than quantity: one metrics-rich case study showing Problem → Solution → Sustained Results beats five vague ones. As you gain more client work, expand your case study library to 8-12.
-
A: Only if the client explicitly permits it. Many clients prefer anonymity. However, if a client is willing, using their name and logo significantly increases credibility. Ask permission: "We'd like to feature your success story on our website to help other companies see what's possible. May we use your name and logo?"
-
A: Sustained results means metrics remained stable (or improved further) 6-12 months after engagement ended. Measure by tracking the same metrics you measured at engagement end: lead time, cost, quality, OEE, cycle time, etc. Conduct check-ins at 3, 6, and 12 months post-engagement.
-
A: This happens, and it's an opportunity to learn. Typically degradation indicates insufficient control measures or sustainability planning. For future case studies, focus on sustained results with specific mention of control mechanisms (SPC charts, standard work, visual management, regular reviews). If a client's results did degrade, don't include it as a case study—instead, learn what to do differently next time.

From custom website design to SEO strategy, we help businesses launch a site that looks professional and performs better.

Author Bio
Walid Hassan is the founder of Squareko,
I'm Walid Hasan, a Certified Squarespace Expert and Squarespace Circle Platinum Partner with over 12 years of hands-on experience designing and optimizing high-performing websites. Over the years, I've had the privilege of building more than 2,000 Squarespace websites for clients around the world, always focusing on clean design, strong user experience, and conversion-driven results.